Page 19 - ebook
P. 19

Peptide Programming Of Nanoparticle As A Theranostic Toolbox


                                                                                                                               Towards Anti-atherosclerosis


                           Seung Eun Yu¹#, Seyong Choung¹#, Young Min Shin¹, Hyo-Jin Yoon¹, Sunghyun Lee¹, Kyubae Lee¹, Suk Kyoung Kim¹,


                                                                                              Hyun-Su Ha¹, Hye-Seon Kim¹, Sewoom Baek¹, Si Young Kim¹, Hak-Joon Sung¹*


                                                                                                                 1   Department of Medical Engineering, Yonsei University College of Medicine, Korea.


                                                                                                                                                                                               *E-mail : hj72sung@yuhs.ac


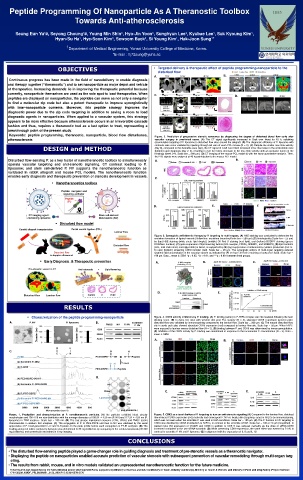
                                                                                                   OBJECTIVES                                                                                                                                                        Targeted delivery & therapeutic effect of peptide programming-nanoparticle to the


                                                                                                                                                                                                                                                                           disturbed flow


                                                                                                                                                                                                                                                                     A.                                                                                                                   B.

                 Continuous progress has been made in the field of nanodelivery to enable diagnosis


               and therapy together (“theranostic”) and to set nanoparticle as major depot and vehicle


               of therapeutics. Increasing demands lie in improving the therapeutic potential because


               currently, nanoparticle themselves are used as the sole spot to load therapeutics. When                                                                                                                                                               C.                                                                                                                                      D.


               peptides are displayed on nanoparticles, the peptides can serve as not only a navigator


               to find a molecular zip code but also a potent therapeutic to improve synergistically


               with inter-nanoparticle contents. Moreover, this peptide strategy improves the


               diagnostic power due to the zip code targeting in addition to saving a room to load


               diagnostic agents in nanoparticles. When applied to a vascular system, this strategy


               appears to be more effective because atherosclerosis occurs in an irreversible cascade


               fashion and thus, requires a theranostic tool as a last option to treat, representing a


               breakthrough point of the present study.


                 Keywords: peptide programming, theranostic, nanoparticle, blood flow disturbance,
                                                                                                                                                                                                                                                                      Figure. 2. Prediction of progressive stenotic severance by diagnosing the degree of disturbed blood flow early after

               atherosclerosis                                                                                                                                                                                                                                        vascular surgery in preclinical cases. (A) The CT signal significantly increased in Graft over Intact for 48 h, validating

                                                                                                                                                                                                                                                                      accumulative targeting of P. liposome to disturbed flow sites around the allograft. (B) The diagnostic efficiency of P. liposome with

                                                                                                                                                                                                                                                                      contrasts was cross-validated by injecting through tail vein of each PCL mouse (N = 3). (C) Despite the similar max flow velocity
                                                                          DESIGN and METHOD                                                                                                                                                                           (day 0), compared to the desirable case (top), the CT signal of Graft over Intact increased more than twice in the undesirable case


                                                                                                                                                                                                                                                                      (bottom) upon diagnosis (day 2–4), resulting in over five times decrease in the max flow velocity with an occlusive lumen in the

                                                                                                                                                                                                                                                                      histology (week 2–6, Scale bar = 200 µm). (D) CT imaging of the mouse PCL model d) with the same quantitative analysis. Then,

                                                                                                                                                                                                                                                                      the IVIS signals were analyzed at 48 h post-injection to the mouse PCL model.

               Disturbed flow-sensing P. as a key factor of nanotheranostic toolbox to simultaneously                                                                                                                                                                 A.                                                                                                                                      B.


               operate vascular targeting and anti-stenotic signaling. CT contrast loading to P.


               liposome; and stem cell-derived P. NV supports the nanotheranostic function as


               validated in rabbit allograft and mouse PCL models. The nanotheranostic function


               enables early diagnosis and therapeutic prevention of stenosis development in vessels.
                                                                                                                                                                                                                                                                      C.


                                                                                          Nanotheranostics toolbox


                                                                                                                                                                                                                                                                    D.                                                                                                E.                                                                          F.


                                                                                                Disturbed flow model


                                                                                                                                                                                                                                                                     Figure. 3. Synergistic anti-stenotic therapy by P. targeting to multi-organs. (A) H&E staining was conducted to determine the

                                                                                                                                                                                                                                                                     neointima formation of ligated vessels (Yellow line: neointima boundary/Scale bar = 200 µm) (B) histologically (Scale bar = 25 µm)

                                                                                                                                                                                                                                                                     by (top) H&E staining (white circle: lipid droplet), (middle) Oil Red O staining (red: lipid), and (bottom) BODIPY staining (green:

                                                                                                                                                                                                                                                                     ROS/blue: nucleus). (C) gene expression of lipid lowering factors (LDL receptor, PPARγ, SREBP1, and SREBP2), (D) lipid contents

                                                                                                                                                                                                                                                                     (LDL, total cholesterol, and triglyceride) in blood, as supported by (E) (top) suppression of inflammatory cytokine production (red: IL-

                                                                                                                                                                                                                                                                     6) upon (bottom) screening CDK9 function (red). Scale bar = 25 µm. The synergistic actions of multi-organ targeting reduced

                                                                                                                                                                                                                                                                     systemic lipid accumulation in the vascular system as indicated by (F) en face Oil Red O staining of aorta (red: lipid). Scale bar =

                                                                                                                                                                                                                                                                     100 µm. Data = mean ± SEM. *p < 0.05; **p < 0.01; and ***p < 0.001 between lined groups.


                                                                      Early Diagnosis  & Therapeutic prevention                                                                                                                                                       A.                                                                              B.                                                                                  C.


                                                                                                                                                                                                                                                                           D.                                                                                                   E.


                                                                                                             RESULTS


                                                Characterization of the peptide programming-nanoparticle                                                                                                                                                           Figure. 4. CDK9 activity inhibition by P. binding. (A) P. binding (ocher) to P-TEFb complex was 3D-modeled following the best

                                                                                                                                                                                                                                                                    docking score. (B) In ApoE KO mice with western diet post PCL surgery (N = 3), abundant CDK9 expression (green) under

                 A.                                                                                                                                               B.                                                                                                disturbed flow was validated by immunostaining compared to the laminar flow. Scale bar = 200 µm. (C) The natural disturbed flow

                                                                                                                                                                                                                                                                    site in aortic arch also showed abundant CDK9 expression (red) compared to laminar flow site. Scale bar = 50 µm. When hAEC

                                                                                                                                                                                                                                                                    were exposed to laminar versus disturbed flow (N = 3), (D) binding between P. and CDK9 was determined by immunoprecipitation.

                                                                                                                                                                                                                                                                    (E) Inhibition of the CDK9 activity by P. binding was determined in response to the incremental P. concentration (N = 3). Data =


                                                                                                                                                                                                                                                                    mean ± SEM.


                                                                                                                                                                                                                                                                     A.                                                                                                                   B.


                 C.


                                                                                                                                                                   D.


                                                                                                                                                                                                                                                                                       C.                                                                 D.                                                                   E.


                 Figure. 1. Production and characterization of P. nanotheranostic particles. (A) the particles exhibited intact circular                                                                                                                             Figure. 5. CDK9 as a touch button of P. targeting to turn on anti-stenotic signaling.(A) Compared to the laminar flow, disturbed

                 morphologies and 100~150 nm size distribution with the average diameters of 106.84 ± 4.38 nm (P. NV) and 117.34 ± 4.59 nm (P.                                                                                                                       flow induced CDK9 expression (red) markedly and consequent P. NV co-localization (targeting: cyan) in hAECs by immunostaining,

                 liposome) in TEM analyses. Scale bar = 200 nm. (B) The test groups maintained exosome (CD9, CD63) and TMSC (actin)                                                                                                                                  which was not seen when the scramble P. was used in both conditions. Scale bar = 100 µm. (B) The P. function in NV targeting to

                 characteristics in western blot analyses. (C) The conjugation of P. to PEG-DSPE and then to NV was validated by the serial                                                                                                                          CDK9 was disabled by siRNA transfection to hAECs, in contrast to the scramble siRNA. Scale bar = 100 or 20 µm (magnified). In

                 appearance of P. bond-generated C=O and N-H peaks on the peak profile before each conjugation in FT-IR analyses. (D) The                                                                                                                            western blot, (C) expression of VCAM1 and CD68 in addition to CDK 9 was reduced markedly as the dose of siRNA-CDK9

                 loading amount of iodine contrast to liposome was determined to 80 mg iodide/mL by comparing to the contrast standards (40-320                                                                                                                      increased compared to the use siRNA-scramble. (D) While preserving CDK9 expression, the same effect was exerted by P. NV in

                 mg iodide/mL) and controls (air and water) in X-ray imaging.                                                                                                                                                                                        contrast to scramble P. NV and P. liposome, (E) in alignment with the expression of IL-8 and IL-1β.


                                                                                                                                                                                                                         CONCLUSIONS


                • The disturbed flow-sensing peptide played a game-changer role in guiding diagnosis and treatment of pre-stenotic vessels as a theranostic navigator.


                • Displaying the peptide on nanoparticles enabled accurate prediction of vascular stenosis with subsequent prevention of vascular remodeling through multi-organ targ


                   eting.


                • The results from rabbit, mouse, and in vitro models validated an unprecedented nanotheranostic function for the future medicine.


                  This research was supported by the Korea Medical Device Development Fund, supported by Ministry of Science and ICT, the Ministry of Trade, Industry and Energy, Ministry of Health & Welfare, and Ministry of Food and Drug Safety (Project Number:

                  1711138302, KMDF_PR_20200901_0152, 2020R1C1C1010579-SEY)
   14   15   16   17   18   19   20   21   22   23   24