


Page 77 - ebook
P. 77
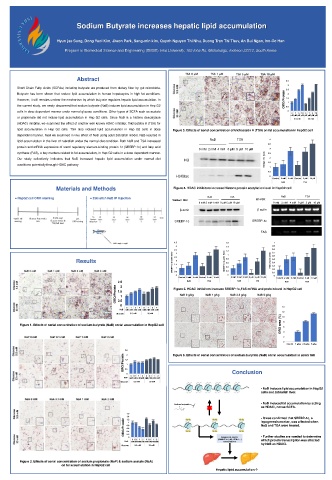
Sodium Butyrate increases hepatic lipid accumulation


                    Hyun jae Sung, Dong Yeol Kim, Jiwon Park, Sang-min kim, Quynh Nguyen Thi Nhu, Duong Tran Thi Thuv, An Bui Ngan, Inn-Oc Han
                      Program in Biomedical Science and Engineering (BMSE) Inha University, 100 Inha Ro, Michuholgu, Incheon 22212, South Korea


                          Abstract                                                            3.5
                                                                                               3
       Short Chain Fatty Acids (SCFAs) including butyrate are produced from dietary fiber by gut microbiota.  2.5
       Butyrate has been shown that reduce lipid accumulation in human hepatocytes in high fat conditions.  2
       However, it still remains unclear the mechanism by which butyrate regulates hepatic lipid accumulation. In  ORO/Protein  1.5
       the current study, we newly discovered that sodium butyrate (NaB) induces lipid accumulation in Hep G2  0.5 1
       cells in dose dependent manner under normal glucose conditions. Other types of SCFA such as acetate  0
                                                                                                       5  10
                                                                                                     1
                                                                                                0
                                                                                                 1
                                                                                                  5  10  0
                                                                                                uM μM μM μM μM μM μM μM
       or propionate did not induce lipid accumulation in Hep G2 cells. Since NaB is a histone deacetylase  5.5 mM  33 mM
       (HDAC) inhibitor, we examined the effect of another well known HDAC inhibitor, Trichostatin A (TSA) for
       lipid accumulation in Hep G2 cells. TSA also induced lipid accumulation in Hep G2 cells in dose  Figure 3. Effects of serial concentration of trichostatin A (TSA) on fat accumulation in HepG2 cell
       dependent manner. Next we examined in vivo effect of NaB using adult Zebrafish model. NaB resulted in
                                                                     NaB      TSA        4
       lipid accumulation in the liver of zebrafish under the normal diet condition. Both NaB and TSA increased
                                                                                        3.5
       protein and mRNA expression of sterol regulatory element-binding protein 1c (SREBP-1c) and fatty acid
                                                                  0 mM  2 mM  4 mM   0 μM 5 μM 10 μM  3
       synthase (FAS), a key markers related to fat accumulation, in Hep G2 cells in a dose dependent manner.  2.5
       Our study collectively indicates that NaB increased hepatic lipid accumulation under normal diet  H3  H3K9ac / H3 (fold)  2
       conditions potentially through HDAC pathway                                      1.5 1
                                                                                        0.5
                                                          H3K9ac                         0
                                                                                          Control 2 mM  4 mM Control  5 μM  10 μM
                                                                                             NaB    TSA
                   Materials and Methods                 Figure 4. HDAC inhibitors increase Histone protein acetylation level in HepG2 cell
       .
      ● HepG2 cell ORO staining  ● Zebrafish NaB IP injection        NaB    TSA             NaB     TSA
                                                         Western Blot               RT-PCR
                                                                  0 mM 2 mM 4 mM  0 μM 5 μM 10 μM  0 mM   2 mM   4 mM   0 μM 5 μM 10 μM
                                                            β-actin                  β-actin
                                                          SREBP-1c                 SREBP-1c
                                                                                      FAS
                                                          4.5              1.6            1
                                      NaB (1 mg/g, 2.5 mg/g)
                                                          4                1.4            0.9
                                                          3.5 3            1.2            0.8
                                                         SREBP-1c/ β-actin (fold)  1.5 1  SREBP-1c/ β-actin (fold)  0.6 0.4  0.4 0.3
                          Results                         2.5 2            0.8 1         FAS/ β-actin (fold) FAS/ β-actin (fold) 0.7 0.6 0.5
                                                          0 0.5            0.2 0          0.2 0.1 0
                                                           Control 2 mM  4 mM Control 5 uM  10 uM  0 mM 2 mM 4 mM 0 μM  5 μM 10 μM  Control 2 mM  4 mM Control 5 uM  10 uM
                                       2.5 2                  NaB    TSA      NaB   TSA       NaB   TSA
                                       ORO/Protein  1.5 1  Figure 5. HDAC inhibitors increase SREBP-1c,FAS mRNA and protein level in HepG2 cell
                                       0.5
                                        0
                                          0  1  2  4  0  1  2  4                             14
                                        NaB  mM mM mM mM mM mM mM mM
                                                                                             12
                                       Glucose  5.5 mM  33 mM                                10
       Figure 1. Effects of serial concentration of sodium butyrate (NaB) on fat accumulation in HepG2 cell  ORO area (%)  8 6
                                                                                             2 4
                                                                                             0
                                                                                              Control 1  g/kg 2.5 g/kg 5 g/kg
                                          2.5 2          Figure 6. Effects of serial concentration of sodium butyrate (NaB) on fat accumulation in zebra fish
                                         ORO/Protein  1.5 1
                                          0.5
                                          0                                  Conclusion
                                           0  0.1  1  2  0  0.1  1  2
                                         NaP  mM mM mM mM mM mM mM mM
                                        Glucose  5.5 mM  33 mM
                                                                                      - NaB induces lipid accumulation in HepG2
                                                                                      cells and zebrafish liver.
                                                                                      - NaB induced fat accumulation by acting
                                                          Sodium butyrate
                                                                                      as HDACi, not as SCFA.
                                          1.6
                                          1.4 1.2                                     - It was confirmed that SREBP-1c, a
                                         ORO/Protein  0.8 0.6 0.4 1                   NaB and TSA were treated.
                                                                                      lepogenesis marker, was affected when
                                           0 0.2                         lipogenesis marker  - Further studies are needed to determine
                                            0 0.1 1  2  0 0.1 1  2      (SREBP-1c, FAS, SCD-1…)  which protein transcription was affected
                                          NaA  mM mM mM mM mM mM mM mM    transcription↑  by NaB as HDACi.
                                         Glucose  5.5 mM  33 mM
       Figure 2. Effects of serial concentration of sodium propionate (NaP) & sodium acetate (NaA)
                     on fat accumulation in HepG2 cell
                                                                       Hepatic lipid accumulation ↑

