
Page 39 - F. Cell biology
P. 39
Effect of Ifenprodil on Kv1.5 Channel Currents
Soobeen Hwang , Su-Hyun Jo 1,2
1
1 Interdisciplinary Graduate Program for BIT Medical Convergence, Kangwon National University, Chuncheon 200-701, Korea
2 Department of Physiology, School of Medicine, Kangwon National University, Chuncheon 200-701, Korea
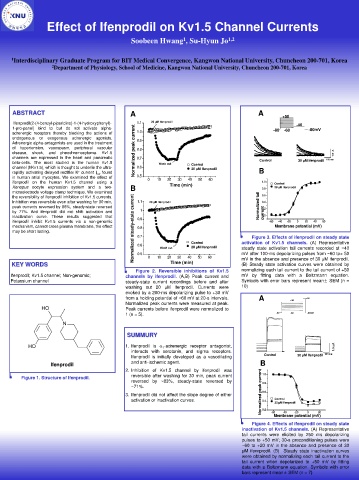
ABSTRACT A A +50
Ifenprodil(2-(4-benzyl-piperidino)-1-(4-hydroxyphenyl)- 1.1 20 µM Ifenprodil -40
1-pro-panol) bind to but do not activate alpha- -80 -60 -80mV
adrenergic receptors thereby blocking the actions of 1.0
endogenous or exogenous adrenergic agonists. 0.9
Adrenergic alpha-antagonists are used in the treatment
of hypertension, vasospasm, peripheral vascular 0.8
disease, shock, and pheochromocytoma. Kv1.5 Normalized peak current 100 νA
channels are expressed in the heart and pancreatic 0.7 100 ms
beta-cells. The most studied is the human Kv1.5 Wash out Control Control 30 μM Ifenprodil
control
channel (hKv1.5), which is thought to underlie the ultra- 0.6 20 µM Ifenprodil
20uM ifenprodil
rapidly activating delayed rectifier K current I kur found B
+
in human atrial myocytes. We examined the effect of 0.5 0 10 20 30 40 50 60
ifenprodil on the human Kv1.5 channel using a 1.0 control
1.0
Control
Xenopus oocyte expression system and a two- B Time (min) 0.8 30uM
30 µM Ifenprodil
0.8
microelectrode voltage clamp technique. We examined
0.6
the reversibility of ifenprodil inhibition of Kv1.5 currents. 0.6
Inhibition was reversible even after washing for 30 min, 1.1 20 µM Ifenprodil 0.4
0.4
peak currents reversed by 86%, steady-state reversed Normalized tail 0.2
0.2
by 77%. And ifenprodil did not shift activation and 1 current
0.0
inactivation curve. These results suggested that 0.0
ifenprodil inhibit Kv1.5 currents via a non-genomic 0.9 -60 -40 -20 0 0 20 40 60
20
40
60
-20
-60
-40
mechanism, cannot cross plasma membrane, the effect Membrane potential (mV)
Normalized steady-state current 0.8
may be short lasting.
0.7 Figure 3. Effects of ifenprodil on steady state
control activation of Kv1.5 channels. (A) Representative
Control
0.6 20uM ifenprodil
Wash out 20 µM Ifenprodil steady state activation tail currents recorded at −40
0.5 mV after 100-ms depolarizing pulses from −60 to+ 50
0 10 20 30 40 50 60 mV in the absence and presence of 30 μM ifenprodil.
KEY WORDS Time (min) (B) Steady state activation curves were obtained by
Figure 2. Reversible inhibitions of Kv1.5 normalizing each tail current to the tail current of +50
Ifenprodil; Kv1.5 channel; Non-genomic; channels by ifenprodil. (A,B) Peak current and mV by fitting data with a Boltzmann equation.
Potassium channel steady-state current recordings before and after Symbols with error bars represent mean± SEM (n =
washing out 20 μM ifenprodil. Currents were 10)
evoked by a 200-ms depolarizing pulse to +30 mV
from a holding potential of −60 mV at 20-s intervals. A +20 +50
Normalized peak currents were measured at peak.
Peak currents before ifenprodil were normalized to
1 (n = 5). -80 -60 -80mV
SUMMURY
1. Ifenprodil is α -adrenergic receptor antagonist, 1.5 µA
1
interacts with serotonin, and sigma receptors.
Ifenprodil is initially developed as a vasodilating Control 30 μM Ifenprodil 10 ms
Ifenprodil and anti-ischemic agent. B
2. Inhibition of Kv1.5 channel by ifenprodil was
1.0
Figure 1. Structure of Ifenprodil. reversible after washing for 30 min, peak current 1.0
reversed by ~83%, steady-state reversed by 0.8
0.8
~71%.
0.6
Normalized peak current 0.6
3. Ifenprodil did not affect the slope degree of either
Control
activation or inactivation curves. 0.4 control
0.4
30uM
30 µM Ifenprodil
0.2
0.2
-60 -40 -20 0 0 20
-40
-20
20
-60
Membrane p
otential (mV)
Figure 4. Effects of ifenprodil on steady state
inactivation of Kv1.5 channels. (A) Representative
tail currents were elicited by 250 ms depolarizing
pulses to +50 mV; 30-s preconditioning pulses were
−60 to +20 mV in the absence and presence of 30
μM ifenrprodil. (B) Steady state inactivation curves
were obtained by normalizing each tail current to the
tail current when depolarized to +50 mV by fitting
data with a Boltzmann equation. Symbols with error
bars represent mean± SEM (n = 7)