Page 127 - 2020년김해시통계연보
P. 127

Agriculture, Forestry and Fishing              125
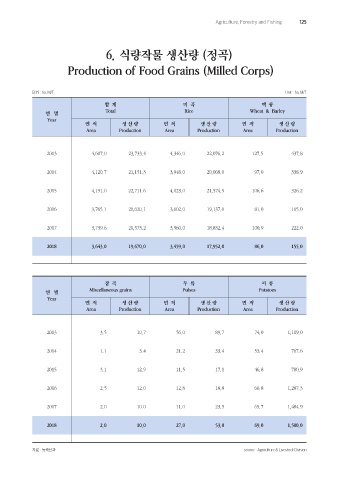


                                      6. 식량작물 생산량 (정곡)

                         Production of Food Grains (Milled Corps)


            단위 : ha, M/T                                                                             Unit : ha, M/T
                                      합  계                       미  곡                        맥  류
                 연   별                Total                       Rice                   Wheat  &  Barley
                  Year
                               면  적         생 산 량         면  적         생 산 량          면  적         생 산 량
                               Area        Production      Area       Production      Area        Production


                  2013            4,607.0      23,733.4      4,346.0      22,076.2        127.5         437.8


                  2014            4,120.7      21,151.3      3,948.0      20,008.0         97.0         338.9


                  2015            4,191.0      22,711.6      4,023.0      21,574.5        106.6         326.2


                  2016            3,765.1      20,620.1      3,602.0      19,137.0         81.0         165.0


                  2017            3,739.6      20,573.2      3,560.0      18,832.4        100.9         222.0


                  2018            3,643.0      19,670.0      3,459.0      17,952.0         86.0         155.0


                                      잡  곡                       두  류                        서  류
                                Miscellaneous grains             Pulses                     Potatoes
                 연   별
                  Year
                               면  적         생 산 량         면  적         생 산 량          면  적         생 산 량
                               Area        Production      Area       Production      Area        Production


                  2013               3.5          10.7         56.0          89.7          74.0        1,119.0


                  2014               1.1          3.4          21.2          33.4          53.4         767.6


                  2015               3.1          12.9         11.5          17.1          46.8         780.9


                  2016               2.5          12.0         12.8          18.8          66.8        1,287.3


                  2017               2.0          10.0         11.0          23.9          65.7        1,484.9


                  2018               2.0          10.0         27.0          53.0          69.0        1,500.0


            자료 : 농축산과                                                                  source : Agriculture & Livestock Division
   122   123   124   125   126   127   128   129   130   131   132