Page 239 - ebook
P. 239

Macrophage inhibitory cytokine-1 aggravated diet-induced gallstone


                                                                                                                                              formation via increased ABCG5, ABCG8 expressions


                                                                                                                                              Min Hee Kim *, Joo-Won Park , Su-Jeong Kim , Inkeun Park , Woo-Jae Park                                                                                                                                                                                                                            1
                                                                                                                                                                                                                                                                                                                                1
                                                                                                                                                                                              1,2
                                                                                                                                                                                                                                                                                                                                                                                    3
                                                                                                                                                                                                                                                                   2


                                                                                                1 Department of Biochemistry, College of Medicine, Gachon University, Incheon, South Korea


                                                                                                2 Department of Biochemistry, College of Medicine, Ewha Womans University, Seoul, South Korea


                                                                                                3 Division of Oncology, Department of Internal Medicine, Gachon Univeristy Gil Medical Center, Incheon, South Korea


                                                                                                         Abstract                                                                                                                                                                        MIC-1 increased phosphorylation of AMPK.


                            Macrophage inhibitory cytokine-1 (MIC-1) is known to be associated with


                cachexia and could be overproduced in various types of cancers. MIC-1 reduces


               appetite by affecting hypothalamus, leading to reduction of body weight. However,


                   the effects of MIC-1 on bile acid metabolism and gallstone formation are poorly


                     understood. In this study, we investigate the mechanism of MIC-1 on bile acid


                 metabolism and gallstone formation. Male C57BL/6J mice were intraperitoneally


                          injected with PBS or MIC-1 (200 ug/kg/week) for 6 weeks while feeding of


                         standard (chow diet) or lithogenic diet. In lithogenic diet fed mice, gallstone


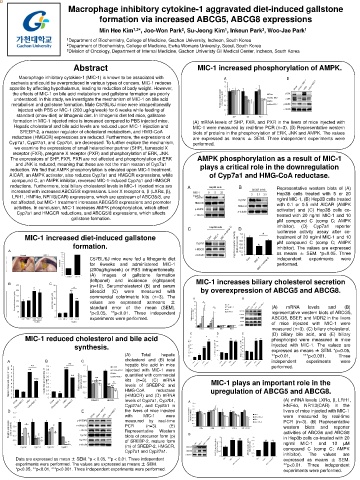
                    formation in MIC-1 injected mice is increased compared to PBS injected mice.                                                                                                                                                                                  (A) mRNA levels of SHP, FXR, and PXR in the livers of mice injected with


                     Hepatic cholesterol and bile acid levels are reduced upon MIC-1 injection and                                                                                                                                                                                MIC-1 were measured by real-time PCR (n=3). (B) Representative western


                             SREBP-2, a master regulator of cholesterol metabolism, and HMG-CoA                                                                                                                                                                                   blots of proteins in the phosphorylation of ERK, JNK and AMPK. The values


                  reductase (HMGCR) expressions are reduced. Furthermore, the expressions of                                                                                                                                                                                      are expressed as means ± SEM. Three independent experiments were


              Cyp7a1, Cyp27a1, and Cyp7b1, are decreased. To further explore the mechanism,                                                                                                                                                                                       performed.


                     we examine the expressions of small heterodimer partner (SHP), farnesoid X


                   receptor (FXR), pregnane X receptor (PXR) and phosphorylation of ERK, JNK.


                The expressions of SHP, FXR, PXR are not affected and phosphorylation of ERK                                                                                                                                                                                            AMPK phosphorylation as a result of MIC-1


                       and JNK is reduced, meaning that these are not the main reason of Cyp7a1                                                                                                                                                                                              plays a critical role in the downregulation


                reduction. We find that AMPK phosphorylation is elevated upon MIC-1 treatment.


               AICAR, an AMPK activator, also reduces Cyp7a1 and HMGCR expressions, while                                                                                                                                                                                                                 of Cyp7a1 and HMG-CoA reductase.


                  compound C, an AMPK inhibitor, reversed MIC-1-induced Cyp7a1 and HMGCR


                reductions. Furthermore, total biliary cholesterol levels in MIC-1 injected mice are                                                                                                                                                                                                                                                                                                     Representative western blots of (A)


                 increased with increased ABCG5/8 expressions. Liver X receptor α, β (LXRα, β),                                                                                                                                                                                                                                                                                                          Hep3B cells treated with 5 or 20


                   LRH1, HNF4α, NR1I3(CAR) expressions, which are upstream of ABCG5/8, are                                                                                                                                                                                                                                                                                                               ng/ml MIC-1, (B) Hep3B cells treated


                 not affected, but MIC-1 treatment increases ABCG5/8 expressions and promoter                                                                                                                                                                                                                                                                                                            with 0.1 or 0.5 mM AICAR (AMPK


                     activities. In conclusion, MIC-1 increases AMPK phosphorylation, which affect                                                                                                                                                                                                                                                                                                       activator) and (C) Hep3B cells co-


                         Cyp7a1 and HMGCR reductions, and ABCG5/8 expressions, which affects                                                                                                                                                                                                                                                                                                             treated with 20 ng/ml MIC-1 and 10


                                                                                                      gallstone formation.                                                                                                                                                                                                                                                                               μM compound C (comp C; AMPK


                                                                                                                                                                                                                                                                                                                                                                                                         inhibitor).                        (D)              Cyp7a1                         reporter


                                                                                                                                                                                                                                                                                                                                                                                                         luciferase activity assay after co-


                                    MIC-1 increased diet-induced gallstone                                                                                                                                                                                                                                                                                                                               treatment of 20 ng/ml MIC-1 and 10


                                                                                                         formation.                                                                                                                                                                                                                                                                                      μM compound C (comp C; AMPK

                                                                                                                                                                                                                                                                                                                                                                                                         inhibitor). The values are expressed


                                                                                                                                                                                                                                                                                                                                                                                                         as means ± SEM. *p<0.05. Three


                                                                                                                                C57BL/6J mice were fed a lithogenic diet                                                                                                                                                                                                                                 independent                                   experiments                                  were


                                                                                                                                for            6weeks                      and               administered                               MIC-1                                                                                                                                                            performed.


                                                                                                                                (200ug/kg/week) or PBS intraperitoneally.


                                                                                                                                (A)              images                        of            gallstone                         formation


                                                                                                                                (leftpanel)                         and               incidence                          (rightpanel)                                                  MIC-1 increases biliary cholesterol secretion


                                                                                                                                (n=10). Serumcholesterol (B) and serum


                                                                                                                                bileacid                       (C)               were                   measured                              with                                           by overexpression of ABCG5 and ABCG8.


                                                                                                                                commercial colorimetric kits (n=3). The


                                                                                                                                values                     are              expressed                            asmeans                           ±


                                                                                                                                standard                        error               of         the             mean                  (SEM).                                                                                                                                                       (A)                  mRNA                          levels                       and                    (B)


                                                                                                                                *p<0.05, **p<0.01. Three independent                                                                                                                                                                                                                              representative western blots of ABCG5,


                                                                                                                                experiments were performed.                                                                                                                                                                                                                                       ABCG8, BSEP, and MDR2 in the livers


                                                                                                                                                                                                                                                                                                                                                                                                  of mice injected with MIC-1 were


                                                                                                                                                                                                                                                                                                                                                                                                  measured (n=3). (C) biliary cholesterol,


                                                                                                                                                                                                                                                                                                                                                                                                  (D) biliary bile acid, and (E) biliary
                                     MIC-1 reduced cholesterol and bile acid                                                                                                                                                                                                                                                                                                                      phospholipid were measured in mice


                                                                                                          synthesis.                                                                                                                                                                                                                                                                              injected with MIC-1. The values are


                                                                                                                                                                                                                                                                                                                                                                                                  expressed as means ± SEM. *p<0.05,

                                                                                                                                                                                  (A)                     Total                       hepatic                                                                                                                                                     **p<0.01,                                   ***p<0.001.                                        Three


                                                                                                                                                                                  cholesterol and (B) total                                                                                                                                                                                       independent                                      experiments                                      were


                                                                                                                                                                                  hepatic bile acid in mice                                                                                                                                                                                       performed.


                                                                                                                                                                                  injected with MIC-1 were


                                                                                                                                                                                  quantified with commercial


                                                                                                                                                                                  kits            (n=3).                 (C)            mRNA                                                                MIC-1 plays an important role in the


                                                                                                                                                                                  levels of SREBP-2 and


                                                                                                                                                                                  HMG-CoA                                      reductase                                                                   upregulation of ABCG5 and ABCG8.


                                                                                                                                                                                  (HMGCR) and (D) mRNA


                                                                                                                                                                                  levels of Cyp7a1, Cyp7b1,                                                                                                                                                                                                        (A) mRNA levels LXRα, β, LRH1,


                                                                                                                                                                                  Cyp27a1, and Cyp8b1 in                                                                                                                                                                                                           HNF4α,                       NR1I3(CAR)                                 in          the


                                                                                                                                                                                  the livers of mice injected                                                                                                                                                                                                      livers of mice injected with MIC-1


                                                                                                                                                                                  with                      MIC-1                           were                                                                                                                                                                   were                measured                           by           real-time


                                                                                                                                                                                  measured                          by            real-time                                                                                                                                                                        PCR (n=3). (B) Representative


                                                                                                                                                                                  PCR                           (n=3).                           (E)                                                                                                                                                               western                       blots                 and                reporter


                                                                                                                                                                                  Representative                                   Western                                                                                                                                                                         activities of ABCG5 and ABCG8


                                                                                                                                                                                  blots of precursor form (p)                                                                                                                                                                                                      in Hep3b cells co-treated with 20


                                                                                                                                                                                  of SREBP-2, mature form                                                                                                                                                                                                          ng/ml                   MIC-1                    and                 10             μM


                                                                                                                                                                                  (m) of SREBP-2, HMGCR,                                                                                                                                                                                                           compound C (comp C; AMPK


                                                                                                                                                                                  Cyp7a1 and Cyp27a1.
                                                                                                                                                                                                                                                                                                                                                                                                                   inhibitor).                        The                  values                      are


                       Data are expressed as mean ± SEM. *p < 0.05, **p < 0.01. Three independent                                                                                                                                                                                                                                                                                                                  expressed as means ± SEM.


                       experiments were performed. The values are expressed as means ± SEM.                                                                                                                                                                                                                                                                                                                        **p<0.01.                         Three                   independent


                       *p<0.05, **p<0.01, ***p<0.001. Three independent experiments were performed.                                                                                                                                                                                                                                                                                                                experiments were performed.
   234   235   236   237   238   239   240   241   242   243   244