


Page 131 - ebook
P. 131
Prognostic extracellular matrix-related genes
   exhibit a cell type-specific expression pattern in non-
                   small cell lung cancer tumors
  Karolina Hanna Prazanowska , Su Bin Lim *
                            1
                    1
  1 Department of Biochemistry and Molecular Biology, Ajou University School of Medicine, Suwon 16499, South Korea ;  * Correspondence
  Introduction Most common type of lung cancer, non-small cell lung  C               D
  cancer (NSCLC), is characterized by poor sensitivity to chemotherapy. Disruption in
  extracellular matrix (ECM) components has long been associated with cancer initiation
  and metastasis. Yet, little is known about the extent to which specific cell populations
  express these ECM genes in NSCLC patients. We previously developed a tumor
  matrisome index (TMI) (1), which comprises exclusively of 29 ECM-related genes
  (COL11A1, COL10A1, SPP1, CTHRC1, MMP12, MMP1, GREM1, S100A2, CXCL13, LPL,
  COL6A6, TNNC1, ABI3BP, PCOLCE2, OGN, ADAMTS8, SFTPC, SFTPA2, SFTPD, FCN3,
  WIF1, CHRDL1, CXCL2, IL6, HHIP, S100A12, CPB2, MAMDC2, and CD36). We
  demonstrated that TMI achieved high accuracy in predicting patients’ survival
  outcomes and responses to adjuvant chemotherpy. However, these findings were
  derived from bulk RNA-seq data, which average global gene expression from diverse
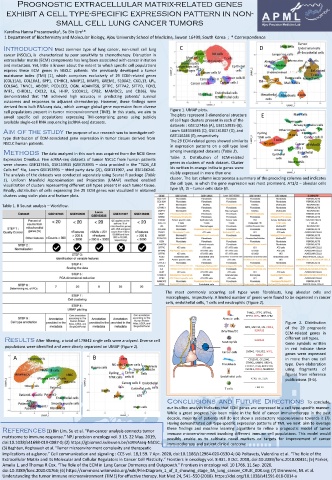
  cell populations present in tumor microenvironment (TME). In this study, we aim to  Figure 1. UMAP plots.
  unveil specific cell populations expressing TMI-comprising genes using publicly  The plots represent 2-dimentional structure  E
  available single-cell RNA sequencing (scRNA-seq) datasets.  of cell type clusters present in each of the
                                                        datasets : GSE127465 (A), GSE153935 (B),
                                                        Loom GSE153935 (C), GSE131907 (D), and
  Aim of the study The purpose of our research was to investigate cell-
  type distribution of ECM-associated gene expression in tumor tissues derived from  GSE136246 (E), respectively.
                                                        The 29 ECM-related genes showed similarity
  NSCLC human patients.
                                                        in expression patterns on a cell type level
                                                        among investigated datasets (Table 2).
  Methods The data analyzed in this work was acquired from the NCBI Gene
                                                        Table 2. Distribution of ECM-related
  Expression Omnibus. Five scRNA-seq datasets of tumor NSCLC from human patients
  were chosen: GSE127465, GSE153935 (GSE153935 – data provided in the “TLDS_All  genes in clusters of each dataset. Cluster
  Cells.txt” file, Loom GSE153935 – third party data (2)), GSE131907, and GSE166246.  Ids written in orange indicate genes were
  The analysis of the datasets was conducted separately using Seurat R package (Table  visibly expressed in more than one
  1). Uniform Manifold Approximation and Projection (UMAP) method enabled  cluster. The last column incorporates a summary of the preceding columns and indicates
  visualization of clusters representing different cell types present in each tumor tissue.  the cell type, in which the gene expression was most prominent. AT1/2 – alveolar cells
  Finally, distribution of cells expressing the 29 ECM genes was visualized in obtained  type l/ll, tS – tumor cells state l/ll.
  clusters using violin plots and feature plots.
  Table 1. R Seurat analysis – Workflow.


                                                       The most commonly occurring cell types were fibroblasts, lung alveolar cells and
                                                       macrophages, respectively. A limited number of genes were found to be expressed in cancer
                                                       cells, endothelial cells, T cells and neutrophils (Figure 2).


                                                                                              Figure 2. Distribution
                                                                                              of the 29 prognostic
                                                                                              ECM-related genes in
                                                                                              different cell types.
   Results After filtering, a total of 179842 single cells were analyzed. Diverse cell
                                                                                              Gene symbols written
   populations were identified and were clearly separated on UMAP (Figure 1).
                                                                                              in red indicate these
                                                                                              genes were expressed
     A                         B                                                              in more than one cell
                                                                                              type. Own elaboration
                                                                                              using  fragments  of
                                                                                              figures from reference
                                                                                              publications (3-6).

                                                       Conclusions and Future Directions To conclude,
                                                       our in-silico analysis indicates that ECM genes are expressed in a cell type-specific manner.
                                                       While a great progress has been made in the field of cancer immunotherapy in the past
                                                       decade, majority of patients still do not show a satistactory responsiveness towards it (7).
                                                       Having demonstrated cell type-specific expression patterns of TMI, we next aim to leverage
                                                       these findings and machine learning algorithms to refine a prognostic model of tumor
  References (1) Bin Lim, Su et al. “Pan-cancer analysis connects tumor
                                                       immune microenvironment involving different immune cell populations. This model would
  matrisome to immune response.” NPJ precision oncology vol. 3 15. 22 May. 2019,
                                                       possibly enable us to cultivate novel markers or targets for improvement of cancer
  doi:10.1038/s41698-019-0087-0; (2) https://gbiomed.kuleuven.be/scRNAseq-NSCLC.;    immunotherapy and patient clinical outcome.
  (3) Baghban, Roghayyeh et al. “Tumor microenvironment complexity and therapeutic
  implications at a glance.” Cell communication and signaling : CCS vol. 18,1 59. 7 Apr. 2020, doi:10.1186/s12964-020-0530-4; (4) Poltavets, Valentina et al. “The Role of the
  Extracellular Matrix and Its Molecular and Cellular Regulators in Cancer Cell Plasticity.” Frontiers in oncology vol. 8 431. 9 Oct. 2018, doi:10.3389/fonc.2018.00431; (5) Parker,
  Amelia L, and Thomas R Cox. “The Role of the ECM in Lung Cancer Dormancy and Outgrowth.” Frontiers in oncology vol. 10 1766. 11 Sep. 2020,
  doi:10.3389/fonc.2020.01766; (6) https://commons.wikimedia.org/wiki/File:Diagram_1_of_3_showing_stage_3A_lung_cancer_CRUK_008.svg; (7) Binnewies, M. et al.
  Understanding the tumor immune microenvironment (TIME) for effective therapy. Nat Med 24, 541–550 (2018). https://doi.org/10.1038/s41591-018-0014-x

